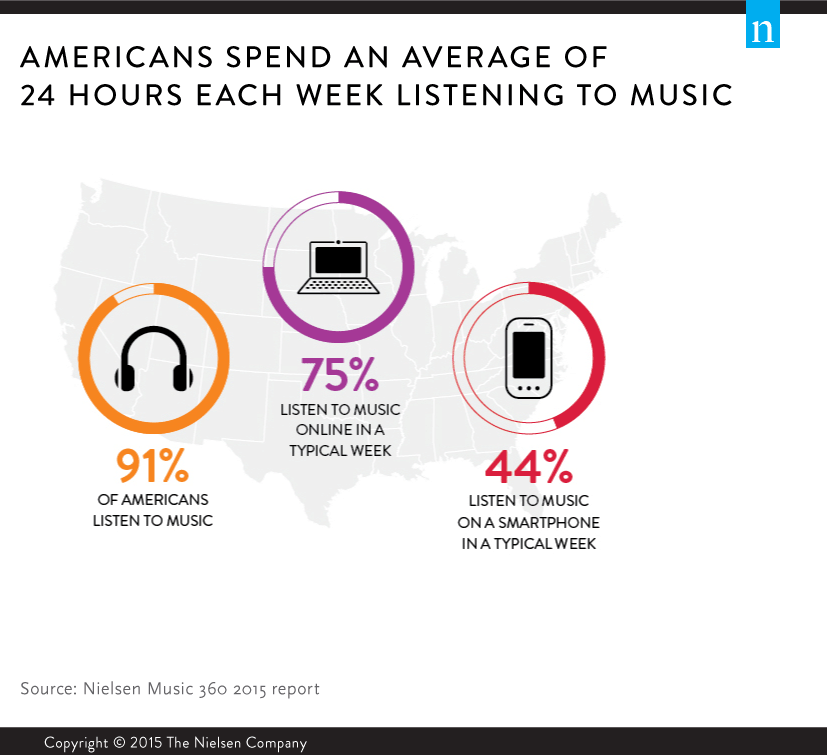
A new report from Nielsen confirms that music is still an important part of most Americans’ lives. The Music 360 2015 Report found that 91% of us listen to music and we spend an average of 24 hours each week listening. That’s an average of 3.4 hours/day…that’s more time than college and university students spend on work and related activities (2.5 hours) and even more time than they spend on educational activities (3.3 hours) (link).
According to Nielsen,
Radio continues to be the No. 1 source of music discovery in the U.S, with 61% of respondents saying they find out about new music from AM/FM or satellite radio, a 7% increase over last year. Word of mouth is also important, particularly for teens: 65% say they discover new music through family and friends, well above the average of 45%.
 According to another report from Nielsen, “On average, U.S. consumers report spending $109 each year on music. So aside from albums, what other types of music options are consumers spending their money on? Surprisingly, live events are gaining momentum, as they now account for more than half of total music activity spending each year.”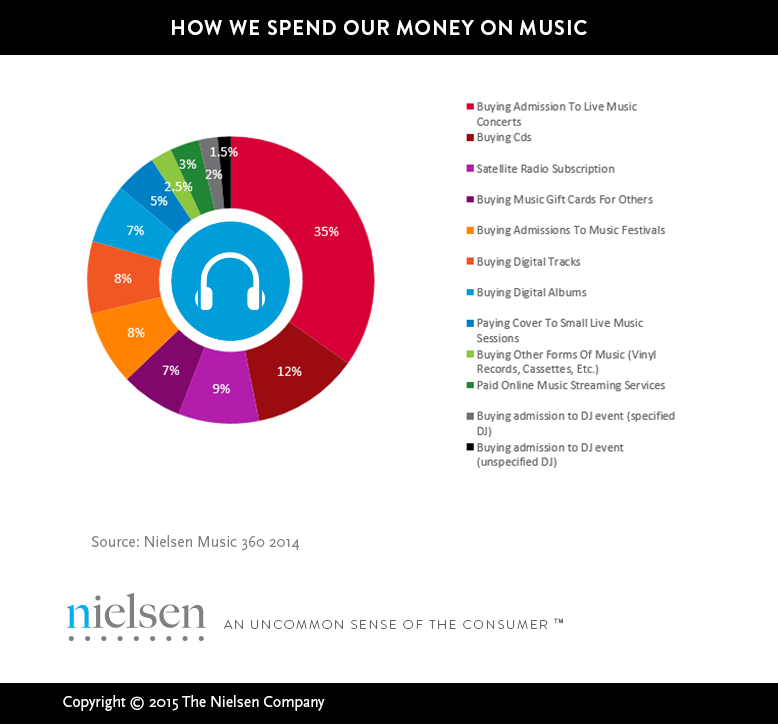
The chart on the right shows how American music consumers are spending (or not spending) their dollars to acquire music. As you can see, live concerts and CDs are the top two ways of purchasing access to music. While this chart may not describe your spending patterns, it is interesting to note that traditional means of acquiring music are still important. And you may also be interested in knowing that two albums alone sold a combined 7 million units last year…dominating album sales. “Combined, Taylor Swift’s 1989 and the Frozen soundtrack accounted for almost half of the year’s top 10 album sales.”
 You may have heard by now that Facebook cooperated with researchers from two universities to study emotional contagion. The question that they wanted to answer was, does the emotional tone of others’ posts on your Facebook wall affect the tone of your posts? To find the answer they conducted an experiment…on nearly 700,000 Facebook users. The methodology was fairly straightforward; they began by using software to analyze posts in order to categorize them as either negative or positive. Then, they manipulated which posts were more likely to show up on the wall of certain Facebook users. By analyzing those users’ posts they were able to determine if they became more positive or negative as a result. Sounds like an interesting experiment for those of us interested in social science and the effect that mediated interactions may have on our personal disposition or behavior.